
22,000 Digital Flood Logs

Ice rinks fill out record thousands of flood logs each year, but the data it has traditionally always stopped there . This past season, in collaboration with Ontario Recreation Facilities Association (ORFA) and Marmak’s new SUB-ZERO platform for digital ice management, we have been able to uncover valuable industry trends. Now for the first time ever, we are able to aggregate data on ice sheet operational trends from community rinks to 20,000 seat spectator arenas.
As a reader reminder: The, ORFA has generously sponsored the flood logs module in SUB-ZERO as a member benefit. Feel free to contact ORFA about this opportunity and to participate in accessing these industry leading solution trends.
This past season 477 rinks that used SUB-ZERO and completed an amalgamated total of 22,000 flood logs since October 1, 2024. The findings are impressive, in short and the data speaks clearly: DIGITAL WINS. Here is a brief overview of the findings.
1. The Paper Problem: A Barrier to Performance
Paper flood logs were once a necessary evil. They gave operators a place to jot down program types, notes, and sometimes snow or water usage — if the fields were not skipped, illegible, or smudged beyond recognition.
But what happens to that data? Typically, nothing. It sits in a binder until the page fills up or someone is asked to manually pull numbers for an audit or complaint. This results in:
• No trend visibility
• No operator accountability
• No performance benchmarks
• No actionable insight
SUB-ZERO’s free flood cut logs module eliminates these roadblocks instantly. With each entry, your rink builds a living dataset — sortable, consistent, and fully visualized in real time.

2. Ice Insights: Water Consumption
Sustainability has become a common end goal for a well-run rink - effectively using technological resources while providing the best product possible. However, great ice always starts will with well trained operators. There is a key difference between operating an ice resurfacer and caring for the ice. Balanced water usage is essential to a solid sheet of ice and patrons notice it the second they get on the ice surface. Obviously different programming and operational needs dictate resurfacing practices, but typically drivers don’t want to dump excessive amounts of water and have a sloppy surface.
From the 22,000 logs collected we found a 1/2 tank of water was used 35.5% of the time, which is the most common usage, with a 3/4 tank coming in at 25.5%. The majority of operators tend to have a good control of their water usage as only 3.6% of the time do they use a full tank of water. Over 6,000 floods collected used a 1/2 tank of water.
For the sake of this article, we can’t get as detailed in the data analysis as we would like. Clearly there is a lot more to consider or layer with these initial findings, such as what the previous program was, the type of flood, current ice thickness and much more. These important pieces of operational information have been collected and analyzed, but and a more thorough analysis will need to be made. The purpose of sharing these initial findings is to provide a high-level introductory teaser to the industry on what’s possible with digital logs analysis. Paper logs would never have made that clear. SUB-ZERO did.
“You can’t change what you don’t measure.”
3. Ice Resurfacer Fuel / Battery Consumption
A common operational concern is the consumption of fuel or energy when it comes to ice resurfacer floods and keeping up with ice resurfacing demands during peak periods, especially during tournaments and busy weekends.
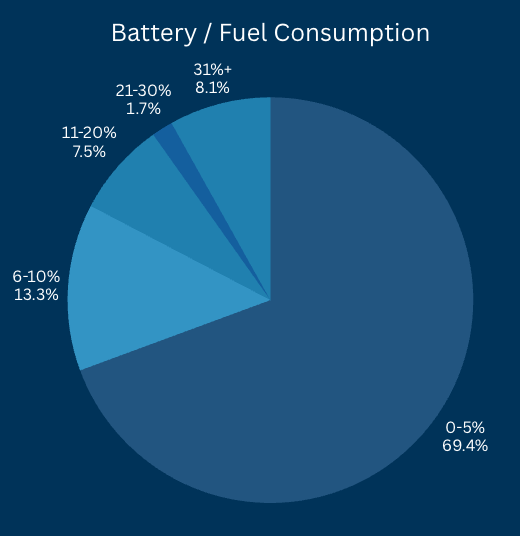
Based on ending battery / fuel consumption, 45.7% of the time a flood ends with a machine still being at 76-100% capacity. Very rarely is a resurfacing completed when a machine is low on charge or fuel (less than 25% capacity) as that only occurred 16.6% of the time.
This sort of data is an aggregate trend but by going digital rinks can actually easily drill down and track each ice resurfacer individually to monitor their consumption and if they are consistently getting low on fuel or charge and what time of day that tends to occur with how many floods typically remained.
Now from start to end of a typical flood, how much charge or fuel is lost? Typically, it’s 10% so you can get an average of 10 cuts out of a charge or tank of fuel,? but Llet’s confirm that with data. Across those 22,000 floods, 6-10% consumption is only 13.3% of the time. 0-5% consumption is most common at 69.3% of the time.
SUB-ZERO can actually take this one step further and tell you consumption based on the operator, rink, electric vs fuel machine, certain models and much more. Let your data work for you and tell you what’s happening in your ice rink. Don’t waste thousands of records a year of valuable data onto paper.

4. Operator Buy In - Will they actually use it?
When adopting anything new one of the first questions is - will our staff actually use this, or will it sit on a shelf? That is a valid concern we’ve seen. When it comes to digital logs we were blown away by the adoption of SUB-ZERO in the industry. The 22,000 readings recorded since October 1, 2024 is proof of that. You need 2 things for successful adoption,
1) Minimum barriers to entry (user friendly system)
2) A product champion - someone in the organization that will be the leader and use the tool while helping and motivating others.
We have heard tremendous stories this past year of young part time operators gravitating to recording their logs digitally. Managers across North America are benefiting from this adoption with direct access to data they never thought possible. Trends are used to improve operations and elevate driver operator performance.
SUB-ZERO flood logs (available as an ORFA member benefit) are crafted to simplify the process which encourages staff to use them. Date, time and operator are already pre-populated. Facility, rink, ice resurfacer, snow collected, water used, etc are all drop-downs making it extremely easy to record in a few taps. A flood log can be submitted to the cloud in under 15 seconds - without walking over to a book and writing it all out every single time.
We are excited about all the rinks that signed up this summer and will join the program to start collecting data this upcoming season. We anticipate far beyond an additional 22,000 logs by the end of next season with even more findings and the ability to compare to this past year’s trends.
5. No Cost, Easy, and Powerful: What’s Stopping You?
Here’s the best part: the flood log module in SUB-ZERO is an ORFA member benefit.
No hardware
No licensing fees
No complicated training
Clean, consistent, cloud-stored data
Key features include:
Log floods from a phone, tablet, or desktop
Track every flood instantly, and digitally
Filter by each item collected
Connect logs to other SUB-ZERO modules
SUB-ZERO is updated regularly with new features based on feedback from fellow rink operators and industry leaders.
6. The Future is Digital — And It’s Here
In an industry built on tradition, adopting new tools can feel like a leap. But with flood logs, that leap is more like a glide. What once was a buried paper trail is now a crystal-clear dashboard of ice maintenance insight. What once required hours of guesswork now takes seconds to visualize. And all of this? ORFA member benefit. Why are you still using paper? Your operators are already doing the work, let their efforts become operational intelligence. With SUB-ZERO, you’re not just recording - you’re leading. Go paperless. Go digital. Go SUB-ZERO.
