
Beneath the Surface: Insights from 2,000 Digital Ice Measurements
A New Era of Ice Management
The collection of ice sheet thickness data and best practices has increased significantly over time as facility operations staff respond to different operational challenges.
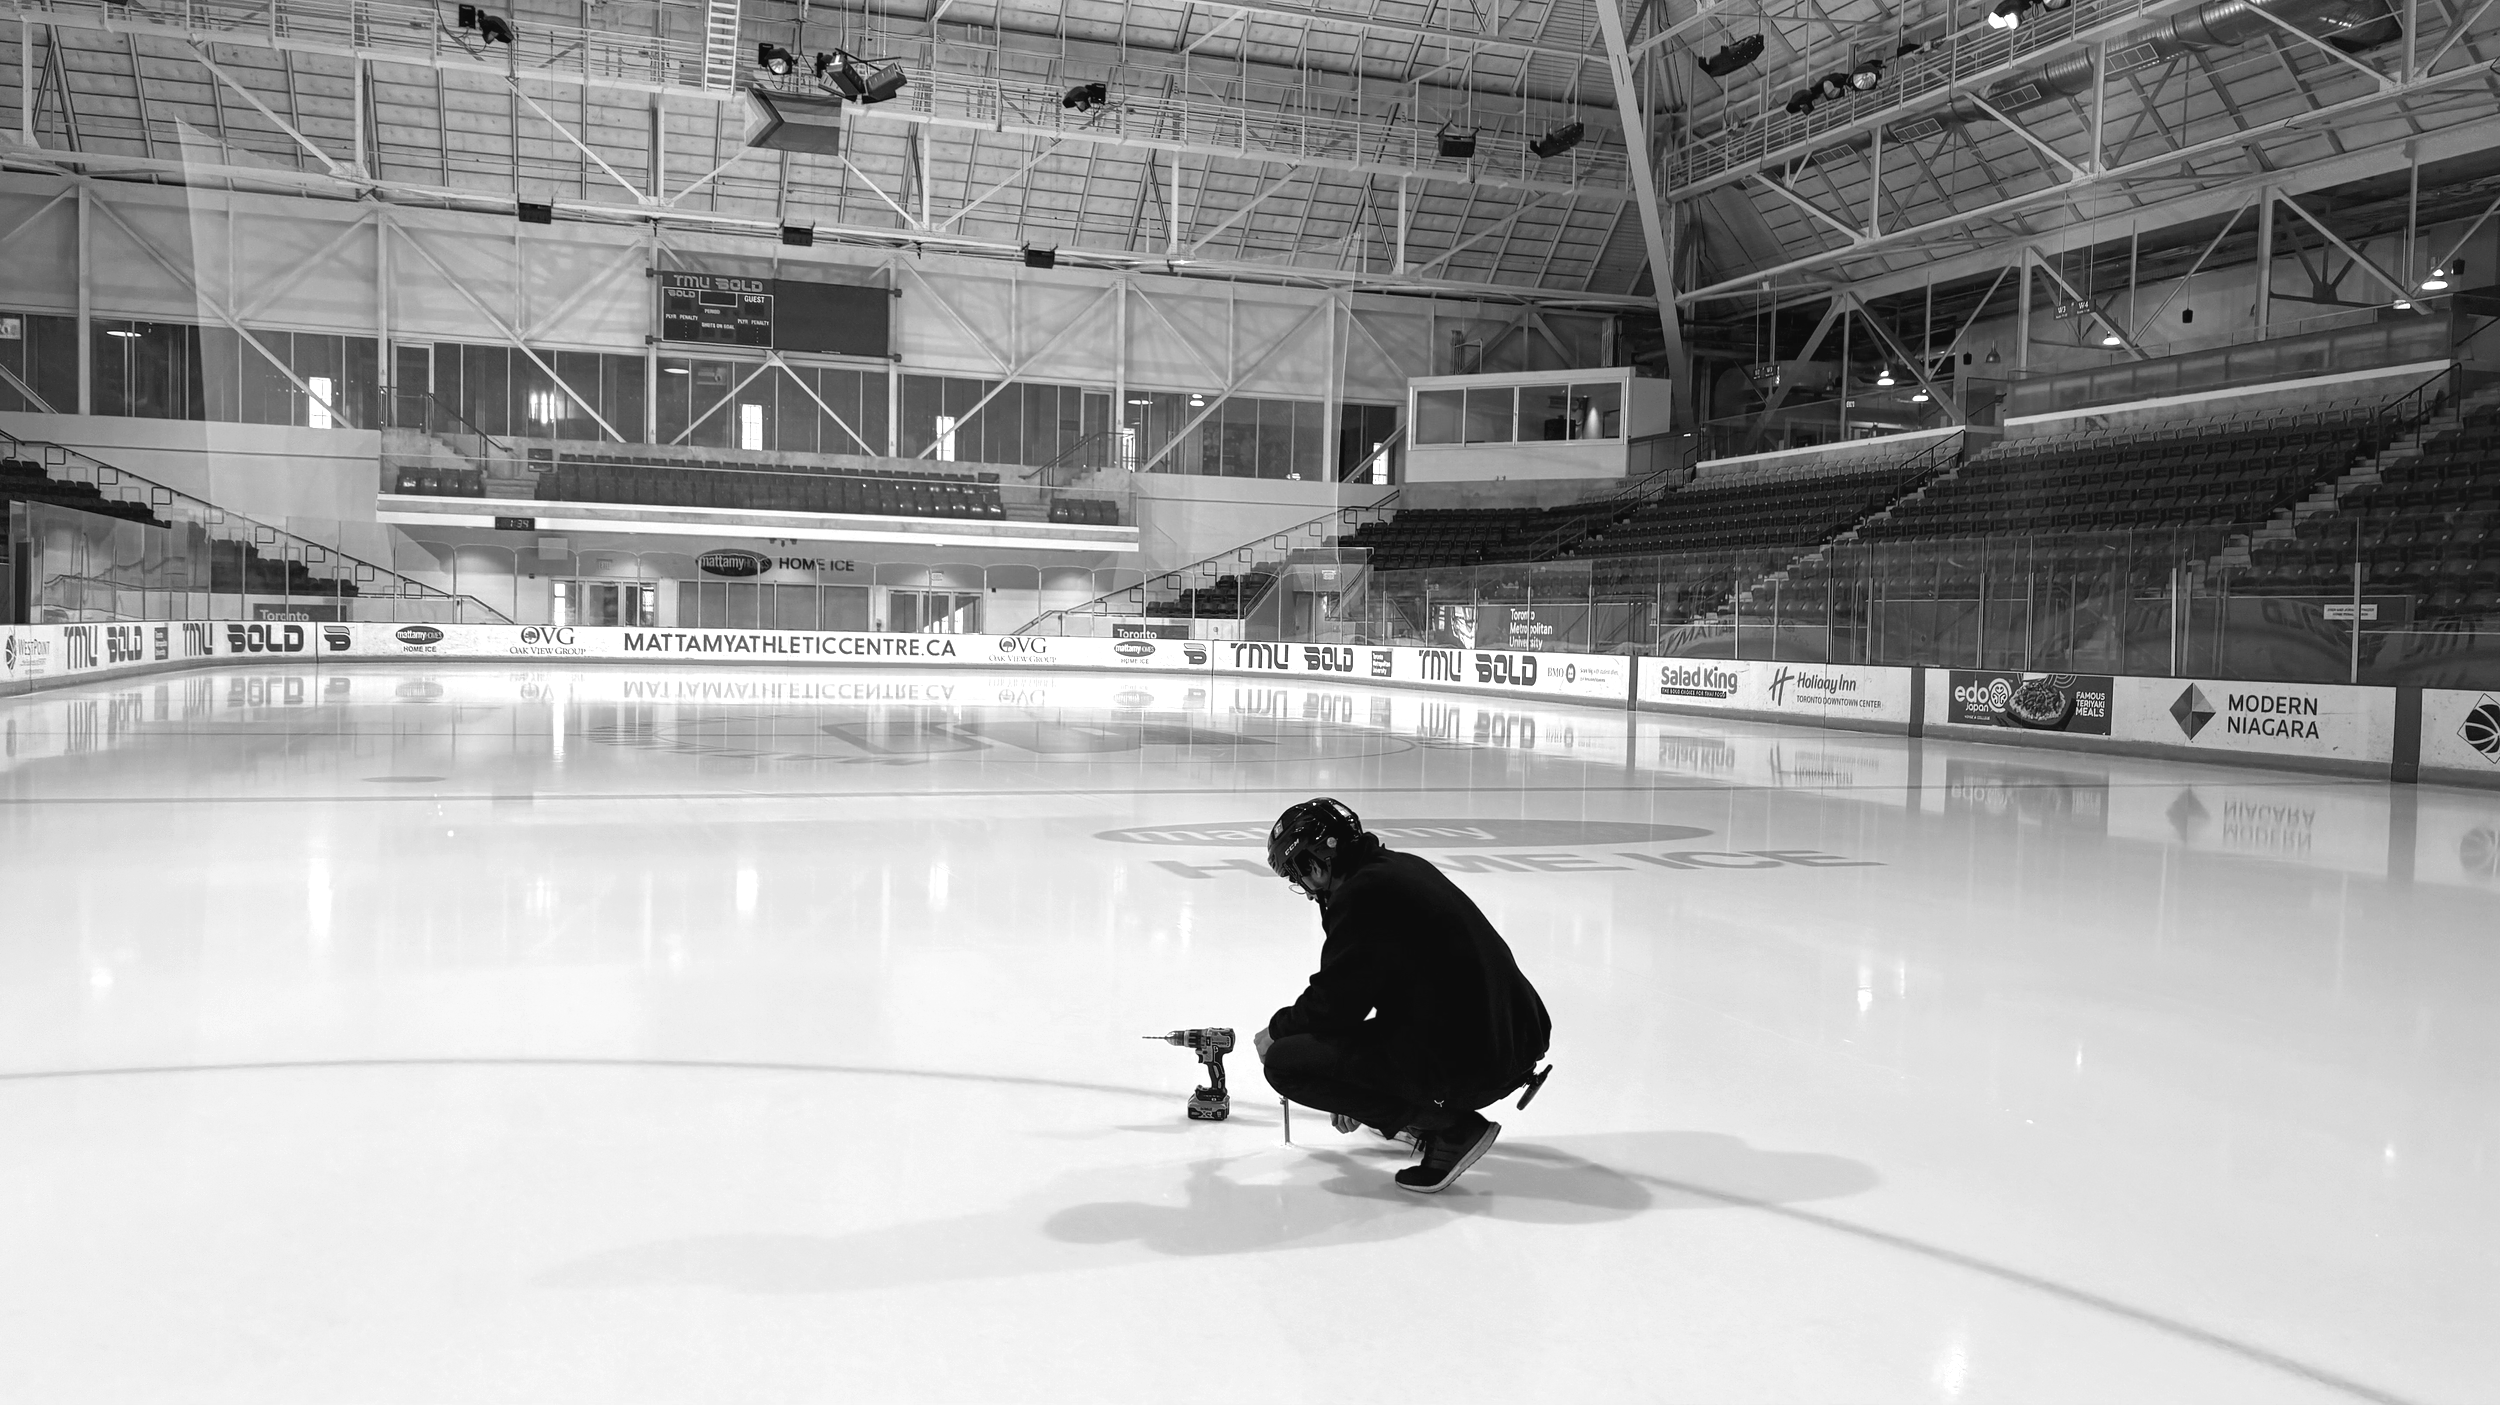
The primary reason for the data collection was the wear and tear and energy consumption of industrial refrigeration plant equipment. Simply stated, the thicker the ice, the harder the plant was forced to perform, which resulted in increased energy costs. A secondary reason can be attributed to the John Stein (circa 1990) skating accident that had the courts analyzing facilities operational practices at the time of the accident. The result was the development of an “industry best practice” to continually monitor ice thickness to be able to prove the ice sheet was safe to be used if ever called into question. Checking ice thickness was typically performed manually with a drill and measuring tape and that information was placed in a paper logbook. These best practices were developed and promoted by the Ontario Recreation Facilities Association (ORFA) as part of the Certified Ice Technician (CIT) professional designation pathway.
It is important to recognize that there is no direct legal requirement to collect ice thickness measurements. Beyond due diligence, the task and its related policy and procedures is an internal decision usually based on industry’s best practice. It is also important to understand that each ice maintenance plan must be custom designed based on a variety of variables that include, but is not limited to, ice pad flatness, type of skating event, ice resurfacer operator capability or advanced ice resurfacer options that can assist in maintaining ice thickness every flood. Ice thickness cannot be developed and forgotten but rather, it is a task that must be continually monitored based on use, special events, operator ability, weather patterns and internal air management equipment.
MARMAK is pleased to share that through a relationship with ORFA, over 40 years of ORFA industry leadership in ice management principles have been taken to the next level by introducing technology that can accurately assist frontline staff in the task of ice thickness management by using SUB-ZERO. A tool that builds from ORFA’s investment in developing industry best practice.

Over 500 rinks across North America and Europe have adopted SUB-ZERO’s interactive ice management platform since released on October 1st, 2024. From small community arenas to 20,000-seat venues, operators now have the ability to track trends, identify inconsistencies, and make data-driven improvements that were previously impossible. Between January and July 2025, nearly 2,000 ice depth readings were logged across participating rinks. What follows is a deep dive into what that data revealed and what it means for operators moving forward.
Disclaimer: These findings are not intended to set industry standards or dictate best practices. Every facility is unique. The following insights represent overall trends from six months of real-world data.
1. Industry Trends Confirmed
For years, operators estimated that average ice thickness was “about an inch and a half.” Now we can say with confidence: they were right.
- Most ice falls between 1.25–1.75 inches
- Outliers still exist: some rinks show ice exceeding 2 inches
These extreme cases are typically linked to uneven floors, inconsistent operator training, or inaccurate data entry. But for the majority of rinks, the long-held “inch-and-a-half rule” holds true.

2. The Power of Accessible Data
For the first time, operators and managers can see the performance of their ice across all sheets they manage. Comparing average thickness, thinnest zones, and thickest zones gives a clear picture of consistency and highlights where improvements are needed.

One pie chart analysis showed that:
- 46.5% of all checks landed between 1.1–1.5 inches
- 92.6% of checks fell between 1.1–2.0 inches
- Very few readings were outside the acceptable range
What drives this consistency? Three factors emerge again and again:
1. Trained Operators
2. Level Floors
3. Modern Tools (laser levels, digital monitoring like SUB-ZERO)

3. Understanding Ice Variance
Variance is the gap between the thinnest and thickest points on a sheet and is just as important as overall thickness. Too much difference creates an uneven playing surface and drives up energy costs.
From the data:
- 0.6 to 1.0 inch variance was most common (40.5% of checks)
- Only 15% of rinks showed variance above 1.5 inches
The culprits? The usual suspects: poor training / unmotivated staff, uneven floors, or lack of technology.
It is also noted by users with growing interest in hockey and other ice related activities, the time to complete ice maintenance each week is shrinking which prevents rinks from maintaining optimal ice conditions.

A comparison of two similarly sized anonymous rinks underscores the point. Despite equal resources, one maintained tight, consistent ice; the other struggled with wide swings in thickness. The difference wasn’t budget; it was discipline and accountability.

4. When Data Changes Operations
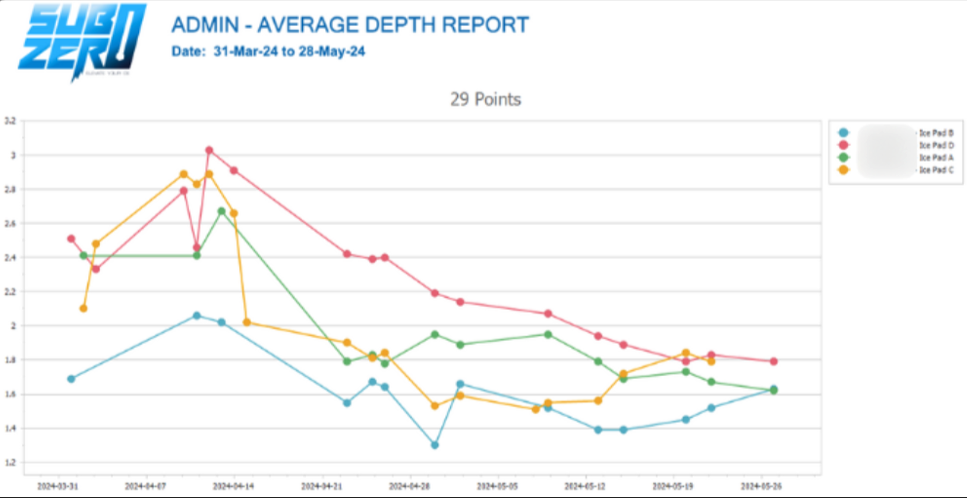
One of the clearest case studies came from a four-pad facility where ice averaged 2.1–3.1 inches. Why? Operators routinely performed double floods at the end of every shift, and logbooks offered no accountability and insight.
Once the facility adopted SUB-ZERO, management could see the problem in black and white. Within a month, average depths dropped to 1.75 inches across all pads.
The results were immediate and noticeable:
- Faster, harder ice praised by user groups
- Reduced water consumption
- Lower compressor hours
- Freed-up staff time (no more double floods)
This is the power of data-driven decision making: better ice, lower costs, and more efficient operations.
One rink manager recently shared, “It’s amazing to see our operations team using SUB-ZERO. They are engaged and want to do ice measurements. In just two weeks our ice went from dangerously scary to consistent.” – Josh Wamboldt (Facility Operations Manager, Lunenburg County Lifestyle Centre, NS)
5. Ice Depths and Resurfacing Practices
Operating an ice resurfacer is a skill, and the data proves it. Many operators unintentionally speed down the neutral zone, leaving it thinner than the rest of the ice.
Analysis of 500 rinks shows:
- Neutral zones (points 11–19) are consistently 0.25–0.5 inches thinner than both ends
- Goal creases (points 2 & 28) are consistently the thinnest spots on both ends of the rink.
These insights give managers actionable feedback. With targeted training, operators can correct flooding habits and improve consistency across the rink.

6. Adoption of Technology is No Longer Optional
The recreation facilities industry is moving quickly. Digital ice management is no longer experimental, it’s mainstream. Tools like SUB-ZERO are being embedded around the world because they deliver what paper never could: real-time insight, long-term trend analysis, and accountability across shifts.
And ice depths are just the start. Today, SUB-ZERO integrates:
- Flood logs
- Surface Temps
- Plant Logs
- Resurfacer logs
- Floor Evaluation
- Water Quality Tests
Each module feeds into a comprehensive view of rink operations, empowering you to not only maintain but elevate your ice.

Conclusion: Elevate Your Ice
The evidence is clear: data makes a difference. Rinks that adopt digital ice depth tracking achieve:
- Maintained ice consistency
- Extended equipment lifespan
- Reduced energy and water usage
- Improved user experience
In an industry where tradition runs deep, technology is proving to be the competitive edge. Whether you manage one community ice sheet or a multi-pad arena, embedding digital tools in your daily operations isn’t just about keeping up with the times - it’s about unlocking better ice, smarter decisions, and sustainable operations.
If you haven’t tried SUB-ZERO yet, now is the time. Reach out for a free one-month trial and see for yourself what’s possible when you look beneath the surface.
